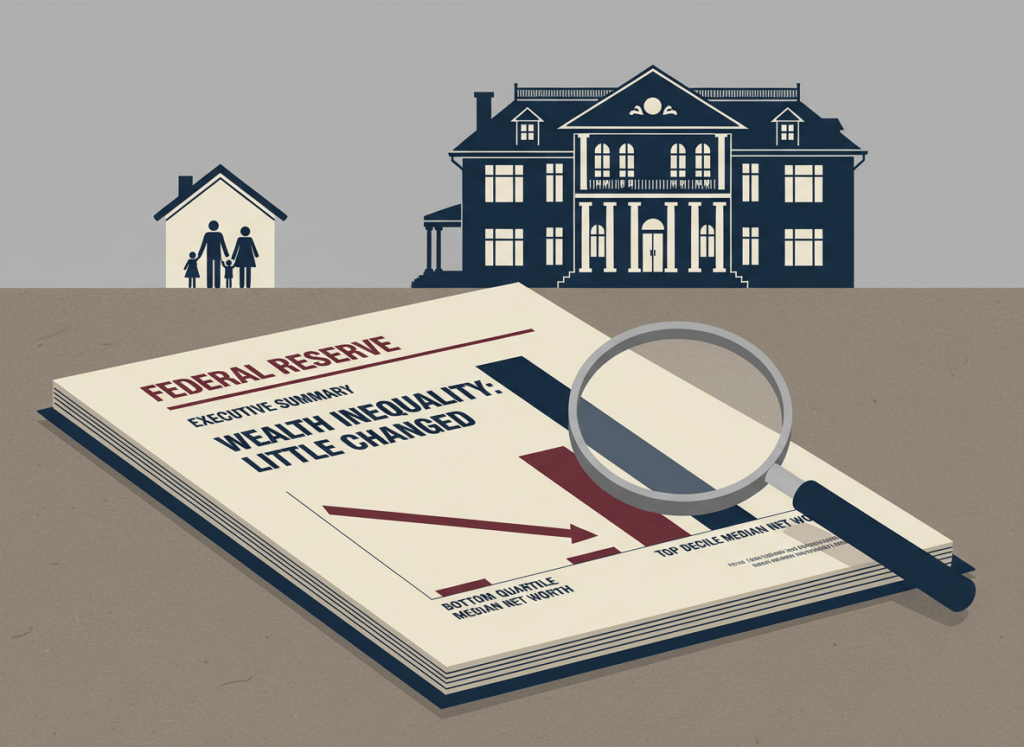
The Federal Reserve Board released its 2025 Survey of Consumer Finances on October 9, and the summary reads like a mild weather forecast. Median income up 7 percent. Median net worth up 2 percent. Wealth inequality “little changed.”
The tables behind it are less restful.
The survey is the Fed’s triennial look at American household balance sheets, built this time on 4,367 family interviews. It is the best data of its kind, which is the reason its summary deserves a harder read than it usually gets.
A Median Rose, a Mean Fell, and Somebody Called It Equality
Real median family income rose from $76,900 to $82,200 between the 2022 and 2025 surveys. Mean family income fell from $155,300 to $145,200. The Fed reads that as a narrowing of the income distribution.
The mean fell because the top fell. Mean income in the top decile dropped 14 percent, and excluding the top 1 percent, the overall mean slipped only 1 percent.
The Fed concedes that top incomes lean on volatile capital gains and business income. It pins a 25 percent drop in mean income for families aged 35 to 44 on falling capital gains.
The base year matters here. The survey measures income for the calendar year before the interview, so the 2022 survey captured 2021. The Congressional Budget Office found that realized capital gains in 2021 were higher than in any year since at least 1979, and that income inequality before taxes and transfers hit an all-time high that year, mainly because of those gains.
That supports an inference, and it is ours, not the Fed’s: the “narrowing” partly reflects a comparison against a record gains year. The reasoning rests on the Fed’s own attribution of top-end declines to capital gains and on the CBO’s 2021 findings. When a peak sits at the start of a comparison, the top falls as markets normalize, whatever happened to ordinary families.
The Fed does acknowledge that the 2025 narrowing only partially unwound a widening between the 2019 and 2022 surveys.
Net worth gets a similar treatment. Median net worth rose 2 percent, from $211,100 to $215,900. The Fed prints standard errors of $8,200 and $6,400 for those two estimates.
Combine them, assuming the two surveys are independent, and the standard error on that $4,800 change is about $10,400. By that arithmetic, which is ours, the change is less than half of one standard error.
Appendix A says the report generally does not address statistical significance and highlights findings that are significant or simply interesting. The 2 percent made the summary anyway.
The Basement Got Lower
Wealth is where the summary’s own sentences pull apart. One bullet says wealth inequality appears little changed. The next says changes in wealth largely reinforced existing gaps between groups.
Both can be true. The summary leads with the calmer one.
Median net worth for the bottom quartile fell from $3,800 to $1,700, a 56 percent drop. The group’s mean stayed negative.
Families under 35 lost 23 percent, falling to $33,000. The Fed blames the unwinding of earlier business equity gains.
Families without a high school diploma lost 55 percent, to $18,600, the largest percentage drop in the modern survey.
Black non-Hispanic families lost 25 percent, to $36,800. The white-to-Black median ratio reached nine to one, the highest since 2016.
Renters lost 7 percent, to $10,600.
Median net worth for the top decile of usual income rose 31 percent, to $3,669,900.
Distress shows up in the credit questions too. The share of families reporting they fell behind on loan payments in the preceding year jumped from 12.2 percent to 19.6 percent.
Those two months or more late rose from 4.9 percent to 8.2 percent. Families with debt payments above 40 percent of income rose from 6.5 percent to 8.6 percent.
The Pause That Helped the People Who Needed It Least
Student debt looks like a success story on the surface. The share of families carrying it fell from 21.8 percent to 20 percent, and the mean balance fell 16 percent, to $43,000.
Box 5 explains why that is less comforting. The top two income quintiles hold 55 percent of outstanding student debt, up from 51 percent in 2001. Yet the top quintile’s own share fell from 30 percent to 25 percent as the debt shifted down the income ladder.
More than half of that shift happened between 2019 and 2025, a stretch the Fed ties to targeted relief and broad payment pauses. A footnote adds that the zero percent interest during the pauses benefited larger balances more, which could help explain why higher earners’ shares shrank.
New 2025 questions about loans already repaid, forgiven, or discharged sharpen the picture. Sixty-one percent of top-quintile families have ever borrowed for school, and they are about 20 percentage points more likely than other income groups to have resolved their loans. In the bottom quintile, 25 percent have ever borrowed and 11 percent still owe.
The Fed’s own conclusion is that the drift toward families with less financial capacity implies higher repayment risk. In plain terms, the debt that remains sits with those least able to retire it.
The picture is still moving. The New York Fed’s August household debt report said student loan delinquencies were distorted by the re-reporting of defaulted loans, per the American Bankers Association’s account.
The Footnotes Know More Than the Summary
Box 4 reports that the monthly payment on a 30-year mortgage covering 80 percent of the median home’s price, plus property tax at 1 percent a year, took about 33 percent of median family income. That is an all-time high for the modern survey, up from 26 percent in 2022.
A footnote says the calculation leaves out maintenance, insurance, and homeowner association fees. It also applies the same property tax rate to every home in the country. The real burden is higher, and the report does not say by how much.
Homeownership sat at about 66 percent, unchanged. The median home was worth more than 4.5 times median family income.
The summary and the body also disagree with each other on benchmarks. The summary says families were more likely to be behind on payments than at any point since the 2010 survey. The body says more than in any of the past four surveys, or since 2016.
The same split appears for payments above 40 percent of income. The summary calls 8.6 percent a level last seen in 2013, the body calls it the largest share since 2010, and Table 5 shows 2013 at 8.2 percent.
None of this changes the direction of the findings. It does change which historical comparison a reader can safely repeat.
One more caution on the headline distress number. The SCF’s 19.6 percent counts families that fell behind at any point in the preceding year, with interviews that began in March 2025. The New York Fed counts the share of outstanding balances in some stage of delinquency at a point in time, and put it at 4.7 percent for the second quarter of 2026, a slight improvement.
Those are different measures of different things. They should not be set side by side as if one confirms or refutes the other.
The Fed’s summary says most families saw moderate gains. Most did. The families who did not are in the tables, where the summary left them.

