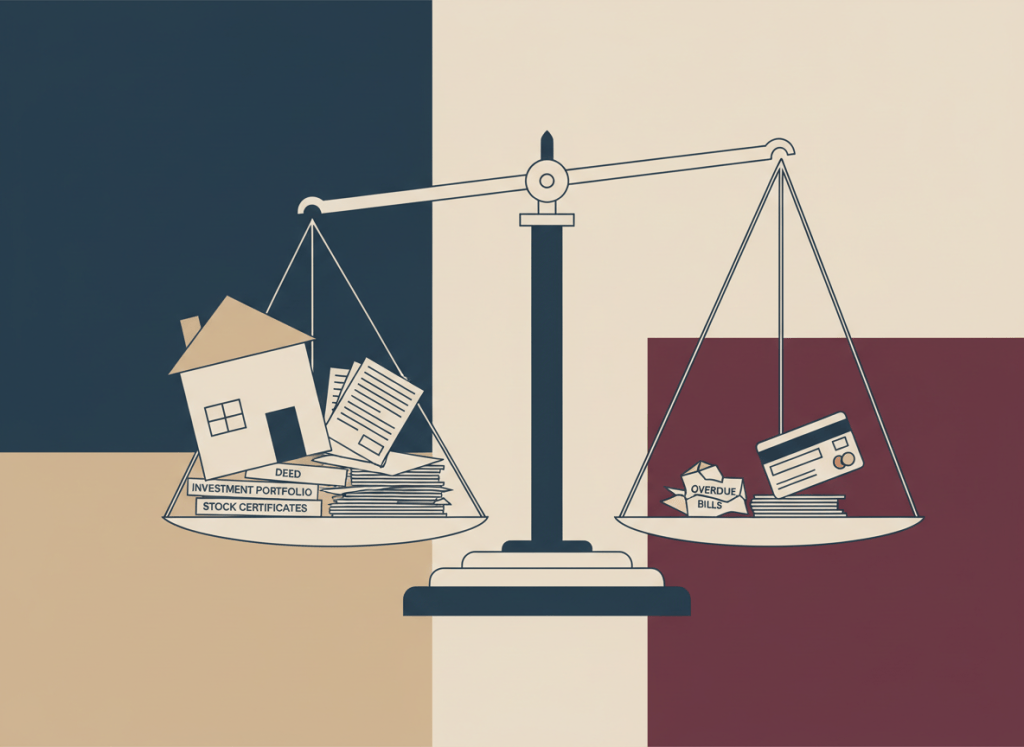
Every three years the Federal Reserve Board sends interviewers out to ask American families what they own, what they owe, and whether they are paying on time. The 2025 results are out under the title Changes in U.S. Family Finances from 2022 to 2025, a 66-page document with the soothing cadence of an institution grading its own homework. Its summary concludes that most families enjoyed moderate gains in income and net worth, while a growing subset appears to be under financial stress. That is true. It is also a sentence doing a great deal of lifting for a data set in which nearly one family in five reports being late on a loan payment.
A Median Is a Comforting Thing
Start with the good news, because the Fed does. Real median family income rose 7 percent between the 2022 and 2025 surveys, from $76,900 to $82,200. Mean income fell 6 percent, from $155,300 to $145,200. The report reads that gap as a narrowing of the income distribution, and it traces the fall in the mean to the top: families in the top income decile saw mean income drop 14 percent, and excluding the top 1 percent shrinks the mean decline to 1 percent. In other words, the rich had a worse year for capital gains and business income, and the statistic flattered everyone else by comparison. (Income is measured for the year before each survey, so these figures describe 2021 and 2024.)
Wealth tells a quieter story. Median net worth rose 2 percent to $215,900, and mean net worth rose 7 percent to $1.24 million. The report calls inequality little changed. Here is an inference, flagged as such: the 2 percent median gain may not be distinguishable from zero. It rests on Table 2, which lists standard errors of $8,200 and $6,400 for the 2022 and 2025 medians. The reported gain is about $4,800 in dollar terms (211.1 to 215.9 thousand). Assuming the two surveys are independent samples, the combined error is roughly $10,000, so the change sits comfortably inside the noise. The report does not make this point itself.
One more figure deserves a place here. A record 37 percent of families said they do not have a good idea of what their income will be next year, a new high in the survey’s history.
One Family in Five Is Behind
The distress indicators are where the report’s tone and its tables part company. Families reporting that they were late on loan payments jumped from 12.2 percent in 2022 to 19.6 percent in 2025. Those two months or more behind rose from 4.9 percent to 8.2 percent. The share of families spending more than 40 percent of income on debt payments rose from 6.5 percent to 8.6 percent, a level not seen since the 2013 survey. The report’s own summary says families were more likely to be behind than at any point since the 2010 survey.
The backdrop is a repricing of credit. Over the same three years, the report says the average 30-year mortgage rate rose from 4.2 to 6.7 percent, new vehicle loan rates rose from 4.9 to 7.7 percent, and credit card rates rose from 14.6 to 21.4 percent. Median credit card debt among those carrying a balance rose to $3,100, the mean rose to $8,000, and the share of families with a buy now, pay later balance climbed from 7 percent to 12 percent.
The authors are careful here. They say the rise in the payment-to-income ratio “may be related” to higher rates, and they stop there. A second inference, again labeled: the report’s own opening page lists conducting monetary policy for stable prices as its first job, and the survey documents what higher borrowing costs and 3.6 percent average inflation did to household budgets. The reasoning is circumstantial. Rates rose, payments consumed more income, and delinquency followed. The report establishes the sequence of events, not the cause, and the Fed does not claim otherwise.
Meanwhile the median leverage ratio for debtors fell to 26.9 percent, continuing a steady decline since 2013, because asset values rose. The report concedes that much of that wealth is tied up in illiquid holdings that cannot easily service a car payment.
The House Always Wins, If You Own the House
Homeownership held at about 66 percent. Median net housing value among owners rose 5 percent to $230,000, a respectable figure that is nonetheless far below the 26 percent average growth between the three prior surveys. The median home is now worth more than 4.5 times the median family income. The report’s alternative measure is blunter: a mortgage covering 80 percent of the median home’s price, plus property taxes, would consume about 33 percent of median family income. That is an all-time high in the modern survey, up from 26 percent in 2022, and the report attributes most of the jump to interest rates.
Owners and renters now live in different countries. Median net worth for owners rose 6 percent to $458,900. For renters it fell 7 percent to $10,600. Families outside metropolitan areas saw median net worth fall 6 percent while metropolitan families saw it rise 6 percent. Among families in the bottom fifth of the income distribution, vehicle ownership fell from 66.4 to 59.4 percent, the lowest in 20 years.
The Wealth Went Where the Wealth Already Was
Where the report is most direct is who gained and who lost. Families under 35 saw median net worth fall 23 percent to $33,000, which the report attributes mainly to the unwinding of business equity gains from 2019 to 2022. Families aged 75 or older saw median net worth rise 37 percent to $504,900, driven, according to the report, by rising retirement account values. The oldest households now hold more median wealth than any other age group.
A third inference, with its source: Table A.5 shows the 75-plus group grew from 12.0 percent to 13.4 percent of all families between surveys. Composition shifts can move group medians, though the authors say retirement balances did the heavy work, and nothing in the report quantifies how much belongs to each explanation.
Education and race show the same sorting. Families without a high school diploma saw median net worth fall 55 percent to $18,600, the largest percentage decline in the modern survey, while their mean net worth rose 53 percent, meaning inequality inside that group grew. Black non-Hispanic families saw median net worth fall 25 percent to $36,800 and median income fall 2 percent to $49,400. The White to Black median wealth ratio is now about nine to one, the widest since 2016. Hispanic families moved the other way, with median net worth up 18 percent and median income up 31 percent, producing the smallest White to Hispanic wealth ratio on record. The bottom quarter of families by net worth now has a median of $1,700.
One caution on the survey itself. Response rates run from about 45 percent in the area sample to 24 percent in the list sample, and 18 percent in the strata expected to hold the wealthiest families. The report says refusal to participate correlates strongly with net worth and that the Fed adjusts its weights accordingly. Readers should treat precise subgroup changes, which carry large standard errors, with matching restraint.
The Fed’s summary is not wrong. Most families did see moderate gains. But the same tables show a growing minority paying more for credit, falling behind on bills, and holding almost no wealth. The report is written in the careful language of an institution that has to keep its job. The data are less polite. The same Federal Reserve that published this survey also oversees the mortgage market whose rising rates the report documents as a primary driver of housing unaffordability — a market where Ginnie Mae now backs $2.6 trillion in mortgage securities with an explicit federal guarantee that its own watchdog says has never been formally stress-tested against the concentration risk underneath it. And for the 19.6 percent of families the survey found late on loan payments, it is worth noting that the same federal government losing revenue to the people at the top is itself a story: the IRS lost $304 billion to fraud, its best defense a mission statement.
Sources
- Aladangady et al., Changes in U.S. Family Finances from 2022 to 2025: Evidence from the Survey of Consumer Finances, Federal Reserve Board, October 2026
- Survey of Consumer Finances data, Federal Reserve Board
- FEDS Notes released with the report: Heterogeneity in the Marginal Propensity to Consume, Informal Support Networks, and Measuring Spending

