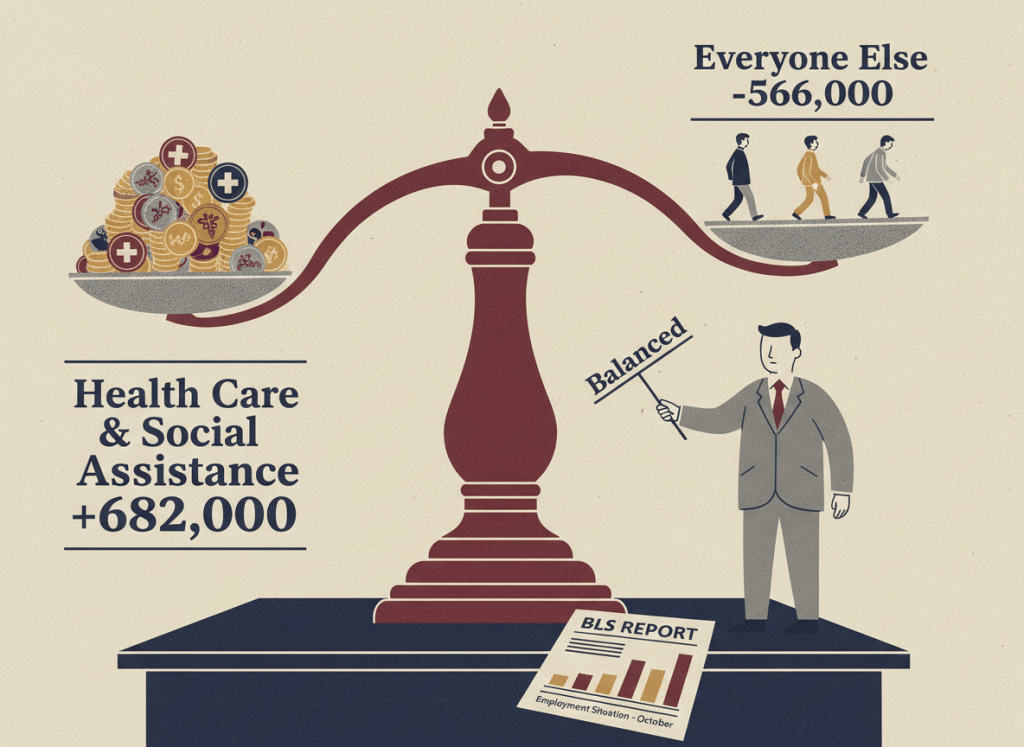
BLS cast 2025 as a neat “balancing act,” with industry gains and losses canceling out. Underneath, health care alone carried the year, the federal workforce shed 287,000 jobs—the steepest drop since 1946—and the headline totals are still being rewritten.
The Scale Was Doing Nothing of the Kind
The Bureau of Labor Statistics has published its accounting of the 2025 job market, and the headline promises harmony. A Monthly Labor Review article says the year’s major industry changes “cancel out.”
They did, in the way a lifeboat and a hole in the hull cancel out.
Nonfarm payrolls grew by 116,000 jobs in 2025, about 10,000 a month. Excluding the pandemic collapse of 2020, BLS calls it the weakest year since 2009. The prior year averaged 122,000 a month.
Private employers added 296,000 jobs, the smallest gain outside a recession since 2003. The 12-month diffusion index stood at 46.0 in December, which means more industries lost jobs than added them.
Then comes the sentence that matters. Private education and health services added 682,000 jobs. Remove that one sector, BLS notes, and the economy would have lost more than half a million.
That is not a balance. It is a dependency with a flattering title.
The Sector That Carried the Year, and Who May Have Been Paying
Health care added 387,000 jobs in 2025. Social assistance added 299,000, and 281,000 of those came from services for the elderly and persons with disabilities.
That category sits inside individual and family services, where BLS says 49 percent of home health and personal care aides work. Home care is also largely a public program. The advocacy group PHI says Medicaid accounts for more than 44 percent of all long-term care spending.
Here is an inference, labeled as one. This publication infers that public money explains a meaningful share of the 2025 growth in that category.
It rests on three sources: the BLS figure of 281,000 jobs in elderly and disability services, PHI’s Medicaid spending share, and a 2026 KFF analysis, as summarized by the National Conference of State Legislatures, finding that 48 states raised home care payment rates to address workforce shortages.
The reasoning is simple: higher public rates, paid to employers in a mostly Medicaid-funded industry, would be expected to produce hiring.
No source reviewed for this article measures that share. A Boston College working paper notes that the formal care workforce has not expanded in step with growth in Medicaid funding for these services, which complicates the story.
The funding picture is also moving. KFF estimates the 2025 reconciliation law cuts federal Medicaid spending by $911 billion from 2025 through 2034. If the sector that held the year together depends on that money, the “balance” has an expiration date.
The data in this corner are fragile as well. In New York, the state labor department’s benchmark moved roughly 43,000 home care jobs out of New York City as the state consolidated payroll processing for consumer-directed home care.
The Center for NYC Affairs calls that an administrative artifact, not a real loss. That is the center’s analysis of state data, not a BLS finding.
BLS has had to repair this industry before. Its 2025 benchmark article notes that in 2022 it found erroneous tax-record employment for the same industry and imputed a March 2022 level about 83,000 higher than the reported figure.
The Workforce Left, and the Paperwork Calls It Voluntary
Government shed 180,000 jobs in 2025 after adding 438,000 the year before. Local government grew by 146,000, which hides the damage. Federal employment fell by 287,000, the largest annual drop since 1946.
The Office of Personnel Management keeps its own count.
OPM said roughly 317,000 federal employees would leave in 2025, with more than 90 percent leaving voluntarily. It also reported about 68,000 hires and about 154,000 deferred resignations.
Subtract OPM’s hires from its departures and the implied net decline is about 249,000. BLS counted 287,000.
That arithmetic is this publication’s, and the two counts use different methods and timing, so they should not match. The distance between them is still worth an explanation.
Timing may explain part of it. This is a second inference.
GovExec reported that deferred resignation participants stayed on paid leave until the end of fiscal 2025. BLS payroll counts include people who received pay for the period, and its benchmark table shows October 2025 as the weakest month of the year at a loss of 140,000.
The reasoning is that paid-leave workers would remain on payrolls until their leave ended, pushing part of the federal drop into the fall.
OPM says 92 percent of departures were voluntary. Former employees told GovExec they left under significant pressure. OPM has also rebutted a Partnership for Public Service analysis claiming agencies paid employees to leave and quietly hired replacements.
The Number Kept Moving After the Press Release
The article reports 116,000 jobs for 2025. BLS’s own benchmark release on February 11, 2026, put the same year at 181,000. The gap is a single month.
December 2025 first printed as a gain of 50,000. The benchmark release carried it at plus 48,000. Then BLS’s March 6 report revised it to a loss of 17,000, a swing of 65,000 jobs.
BLS attributes monthly revisions to additional reports and recalculated seasonal factors.
A Congressional Research Service review found that first estimates in 2024 captured about 60 percent of expected responses, against about 91 percent by the third, and that government employers often report late. This publication found no industry breakdown of December’s revision.
The larger revision came earlier. The benchmark cut March 2025 employment by 898,000, or 0.6 percent, against a ten-year average of 0.2 percent. BLS also left about 83,000 taxi and limousine jobs found in tax records out of the benchmark pending research, counting only 10,400.
The shutdown added its own wrinkle. The funding lapse ran 43 days, and BLS could not collect October household survey data, which it says cannot be gathered retroactively.
Payroll data kept flowing, and the first September estimate carried a collection rate of 80.2 percent, higher than usual. This publication found no source linking the shutdown to the later revisions.
The measuring agency is under strain of its own. President Trump fired the BLS commissioner on August 1, 2025, hours after a report with large downward revisions, alleging manipulation without evidence. A career BLS economist has since been confirmed to the post.
In February 2026, 13 of 35 listed leadership roles sat vacant under a hiring freeze of more than a year, and real funding is down about 20 percent since 2010.
The figures may still move. A preliminary 2026 benchmark showed a downward revision of 79,000, and the final arrives in February 2027. Under BLS’s method, the monthly figures from April through December 2025 can change again.
The economy, per BLS, balanced. The revision schedule suggests the scale is not finished weighing.

