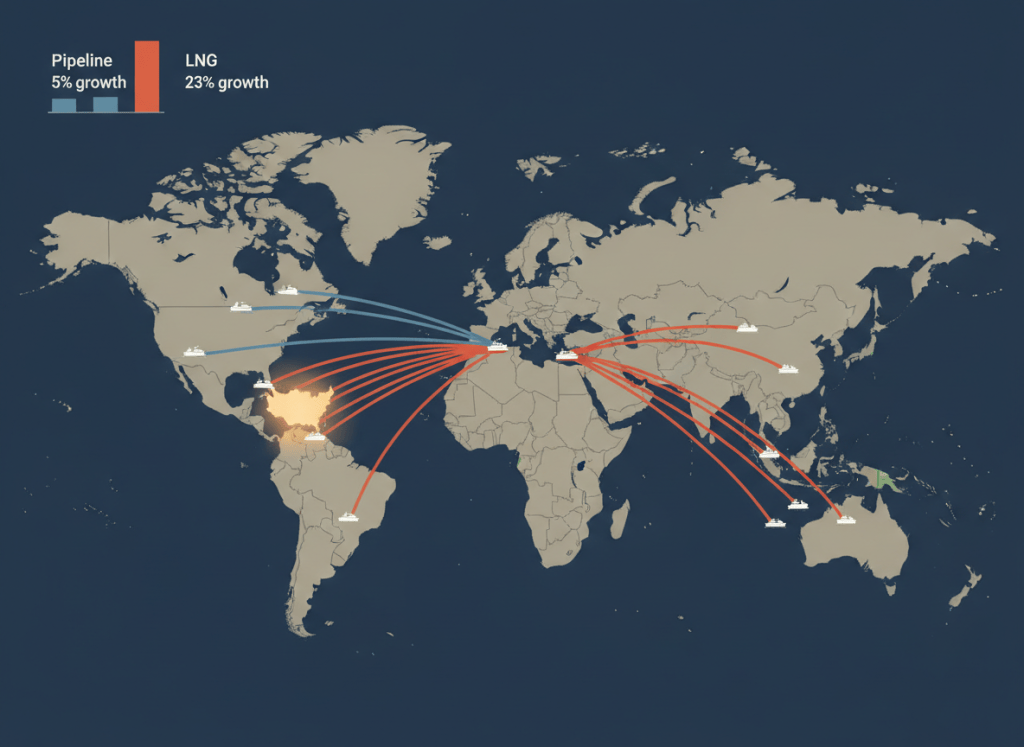
The United States is exporting considerably more natural gas in 2026 than it did a year ago. But buried inside the Department of Energy’s latest monthly trade report is a second development: increasingly, the growth is coming from liquefied natural gas headed toward Asia and Africa rather than Europe.
U.S. natural gas exports reached 827.2 billion cubic feet in July, while imports totaled 251.8 Bcf, leaving the country with 575.4 Bcf in net exports for the month. Total exports were 15% higher than in July 2025, while net exports increased 26%.
The longer view is even more pronounced.
During the first seven months of 2026, the United States exported 5.78 trillion cubic feet of natural gas, up 16% from the same period last year. Imports moved in the opposite direction, declining 6% to 1.82 Tcf.
The result: U.S. net natural gas exports reached 3.96 Tcf through July, a 29% increase from the first seven months of 2025.
And LNG is doing much of the heavy lifting.
U.S. LNG exports by vessel totaled 3.69 Tcf through July, up 23% from the comparable period last year. Pipeline exports, meanwhile, increased 5%.
That growth is increasingly showing up thousands of miles from the European markets that became synonymous with American LNG following the disruption of Russian energy supplies to Europe.
Europe remains the largest regional destination for American LNG so far this year, receiving 2.06 Tcf through July. But that figure was actually 1% lower than during the same period in 2025.
Asia went the other way.
U.S. LNG exports to Asia reached 1.03 Tcf through July, an 89% year-over-year increase. Exports to Africa more than doubled, climbing 120% to 398.3 Bcf. Latin American and Caribbean shipments declined slightly, by 2%.
By July, the geographical shift was difficult to miss.
Asia received 201.5 Bcf of U.S. LNG during the month, representing about 39% of exports. Europe received 200.5 Bcf — also about 39%.
But those nearly identical totals conceal dramatically different trajectories.
Compared with July 2025, American LNG exports to Asia increased 116%. Exports to Europe fell 16%. Africa, which received another 77.6 Bcf, was up 22%.
The country-by-country figures are even more revealing.
Egypt was the largest destination for U.S. LNG in July, receiving 75.6 Bcf, or 14.6% of all American LNG exports. The Netherlands followed with 54.7 Bcf, India with 47 Bcf, Japan with 46.9 Bcf and Italy with 40.9 Bcf.
Together, those five countries accounted for slightly more than half of all U.S. LNG exports during the month.
Some of the year-over-year changes are substantial.
July LNG exports to India increased 224% compared with July 2025. Shipments to Japan increased 172%, Thailand 117%, Italy 67% and Taiwan 63%.
Several European destinations moved sharply in the other direction. Germany was down 32% from July 2025, Spain 49%, Poland 27% and Greece 48%.
The monthly figures aren’t isolated anomalies in every case.
Through July, Egypt had received 390.2 Bcf of American LNG, an increase of 122% from the first seven months of 2025. India’s purchases increased 138%, Taiwan’s 210%, Thailand’s 155%, Japan’s 61% and South Korea’s 43%.
There is another part of the story on the American side of the loading dock.
New and expanding export capacity is increasingly appearing in DOE’s actual shipment numbers.
Plaquemines, Louisiana, exported 756.6 Bcf during the first seven months of 2026, more than double the 353.4 Bcf reported during the comparable period last year. Corpus Christi exports increased 39% to 627.3 Bcf.
Golden Pass, Texas, meanwhile, appears in the 2026 year-to-date export statistics with 17.3 Bcf after recording none during the comparable 2025 period.
Sabine Pass remains the country’s largest individual LNG exit point, accounting for 890.1 Bcf through July. But the numbers suggest that the U.S. export system is becoming both larger and less dependent on any single terminal — at the same time its overseas customer base is spreading across more markets.
In July alone, U.S.-produced LNG reached 35 countries. LNG represented 62.7% of all U.S. natural gas exports during the month, totaling 518.7 Bcf. And 85.7% of those LNG exports went to countries without a U.S. free-trade agreement.
None of that means Europe has ceased being an important market for American LNG. Quite the opposite: it remains the largest regional destination on a year-to-date basis.
But DOE’s July numbers show something beyond the familiar European energy story.
The United States is exporting substantially more natural gas. LNG is driving much of that growth. And some of the fastest increases are now occurring in Asia and Africa.
America’s natural-gas export boom, in other words, is becoming increasingly global.
The evidence occupies 56 pages of maps, tables, monthly comparisons, country destinations and export terminals — because apparently moving half a trillion cubic feet of liquefied natural gas around the planet in a single month is the easy part.
Explaining where it all went requires a federal spreadsheet.

